
Energy analytics
The estate, measured.
Six views over the same data your bills are validated against. Choose a scope and a period once, and every one of them answers for it.
What you get
Six questions, already answered.
Not a chart builder. Six views that each answer something a person actually asks, over whichever part of the estate you scope them to.
- 01
Validation & Savings
What the checks found, what it was worth, and what is still open.
Recovered and disputed amounts over the period, traced back to the invoice line that produced them.
- 02
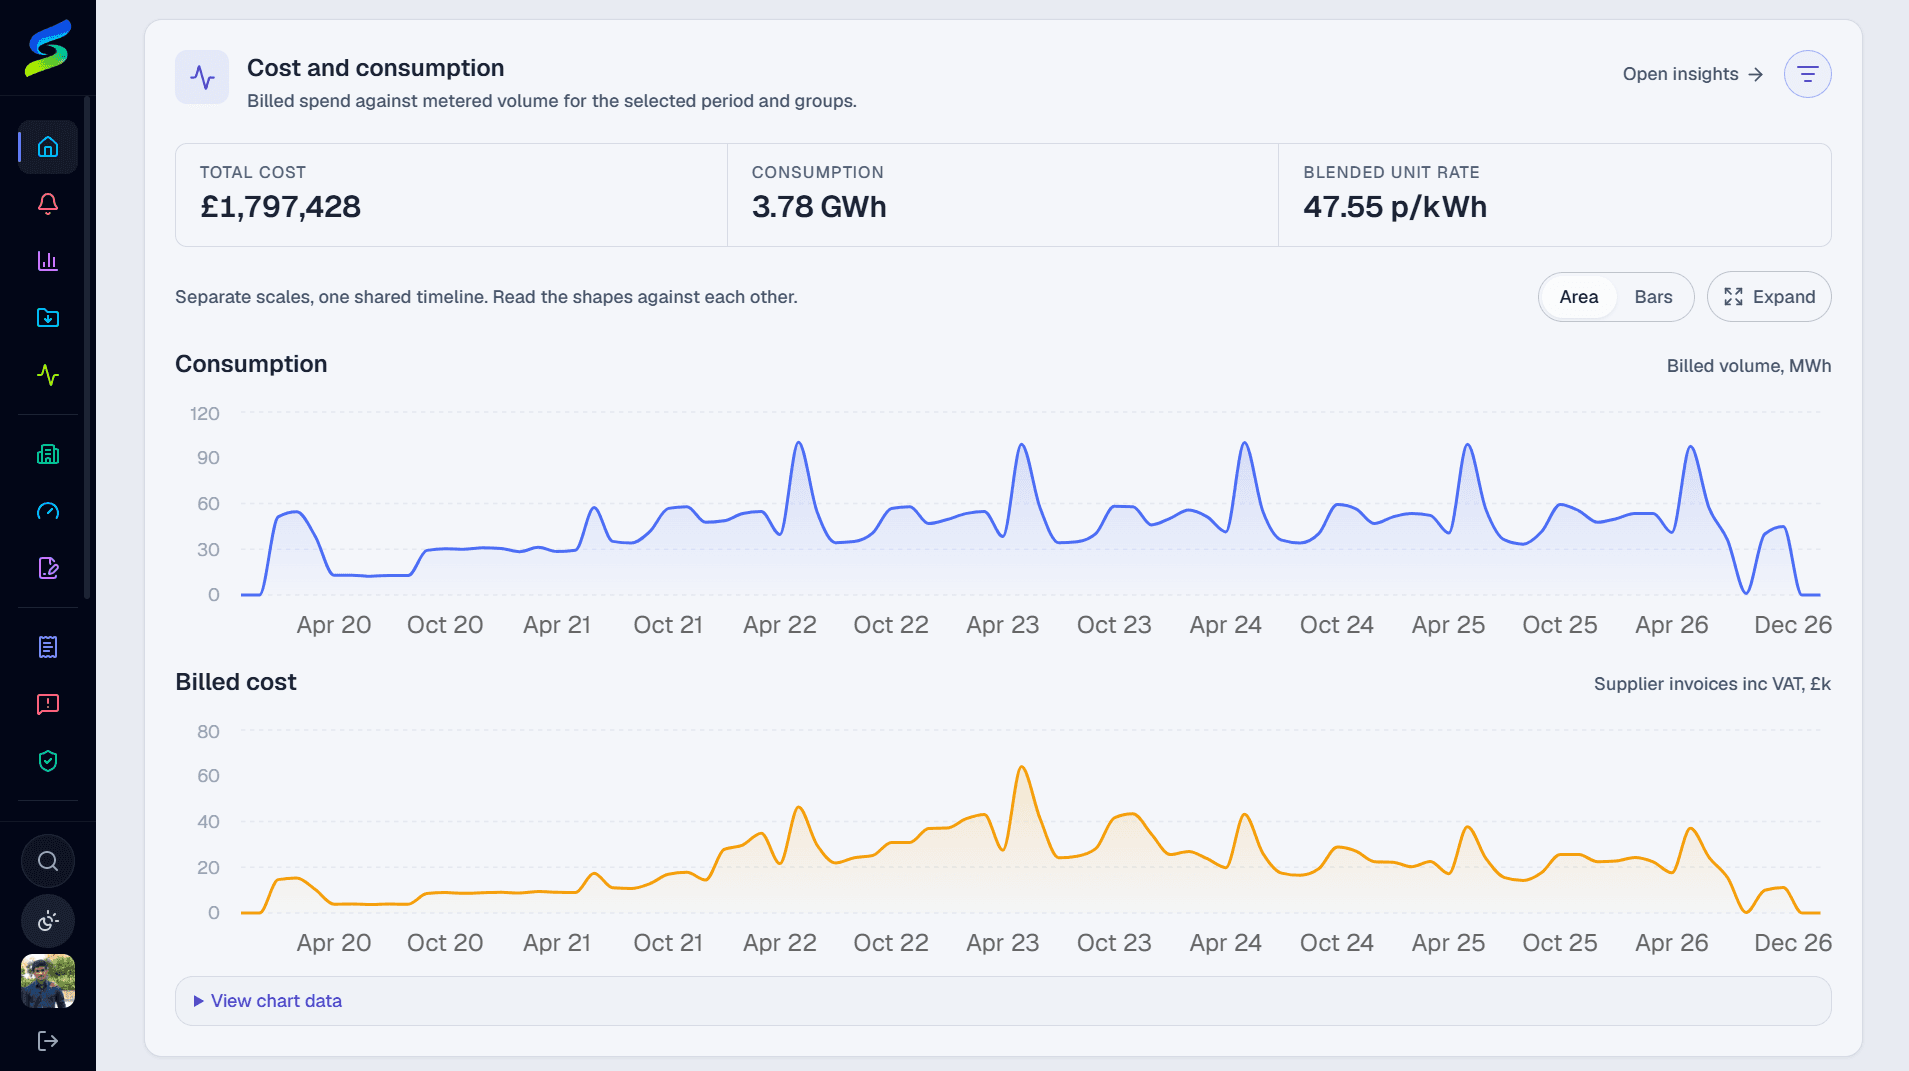
Consumption & Cost
Spend and measured volume on one shared timeline.
Separate scales, so the shapes can be read against each other and a divergence between what you paid and what you used is visible rather than inferred.
- 03
Budget vs Actual
The position against the number you committed to.
Built from validated figures rather than a parallel spreadsheet, so the variance does not need reconciling before anyone can use it.
- 04
League Table
Sites ranked, including by intensity rather than by size.
A large site consuming a lot is not news. Ranking by intensity is what surfaces the small site that is quietly the worst one you own.
- 05
Vacant Energy
What the estate burns while nobody is in it.
Half-hourly consumption read against each site's own recorded operating hours, so out-of-hours is defined per site instead of assumed across the estate.
- 06
Carbon
Emissions on the same data as the cost.
Derived from the metered volume already loaded, which is what makes the carbon number and the finance number agree.
Same numbers as the bills
One set of figures, not two.
The analysis reads the validated bills and the half-hourly data already in the system. There is no second load, no separate model, and nothing to reconcile before a chart can be trusted.
- Scope to the whole estate, a group, a site or a single meter
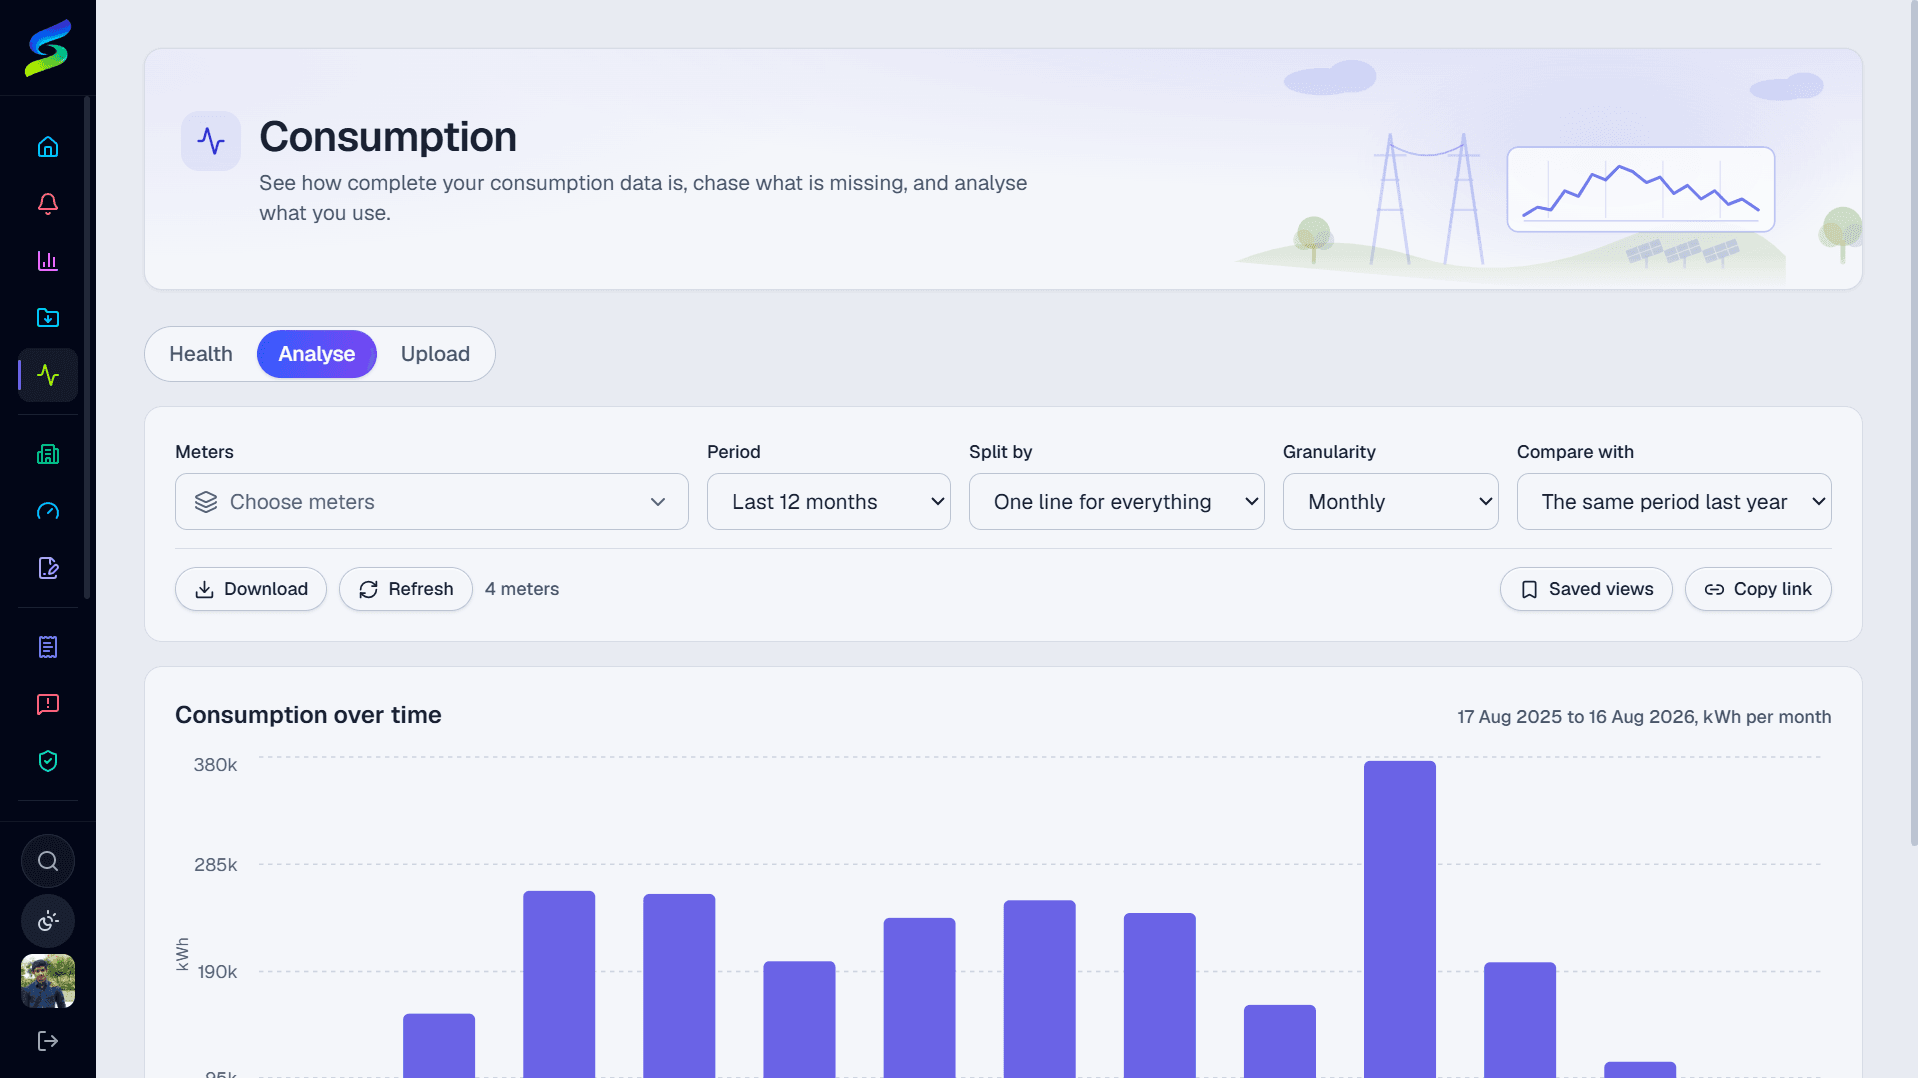
- Any period, at the granularity the question needs
- Compare against the same period last year
- Every chart carries the table it was drawn from, and downloads
- Save a view, or send someone the link to exactly what you are looking at
Why intensity, not totals
The worst site is rarely the biggest one.
Ranked by consumption, an estate tells you which sites are large. Ranked by intensity, it tells you which ones are wrong. Those are different lists, and only the second one is worth acting on.
Why vacant energy
Empty buildings are not free.
Out-of-hours load is the one number that is almost never budgeted and almost always recoverable. Measuring it needs each site's real operating hours, which is why they are recorded per site rather than assumed.
Bring a year of half-hourly data
We will load it, run the six views over your own estate, and show you which sites the intensity ranking puts at the top.